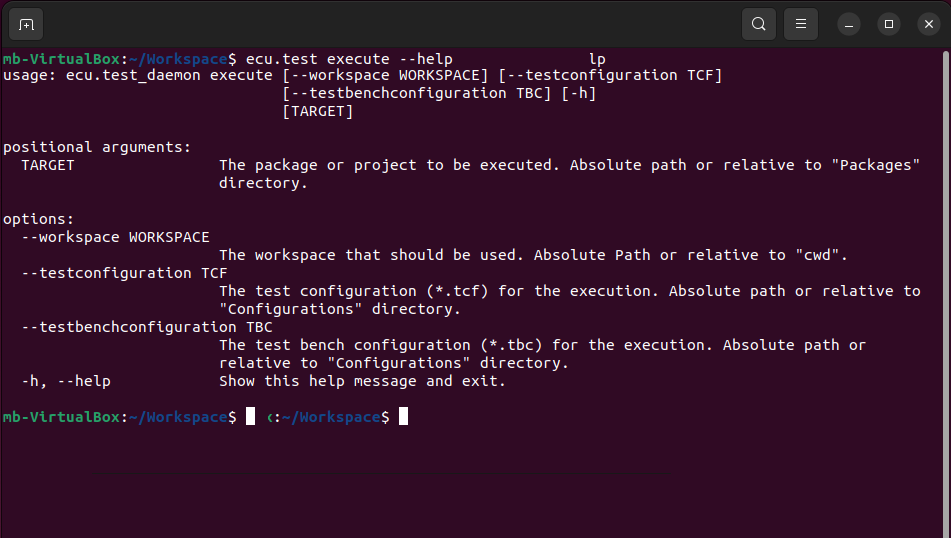
ecu.test 2024.4 introduces a new Command Line Interface (CLI) that makes it much easier to use in Docker and CI environments. This new CLI enables user to specifically execute a project or package in a defined workspace - without the detour via an additional Python environment and REST API. In addition to reducing dependencies and simplifying maintenance, this also saves execution time.
The new CLI provides the basis for further planned use cases and functional enhancements to make the use of ecu.test in CI environments even more efficient.
trace.check Release 2024.4
Highlight features
Introduction of a new CLI for ecu.test in Docker and CI environments
- New CLI for executing projects and packages:
The new CLI allows users to start a single ecu.test project or package in a specific workspace using the new “execute” subcommand. - Automatic termination and return codes:
Once execution is complete, ecu.test terminates automatically and provides return codes that enable direct further processing of the test results - ideal for CI environments where fast feedback and automated process chains are important.
Parameterizable mapping in parameter set
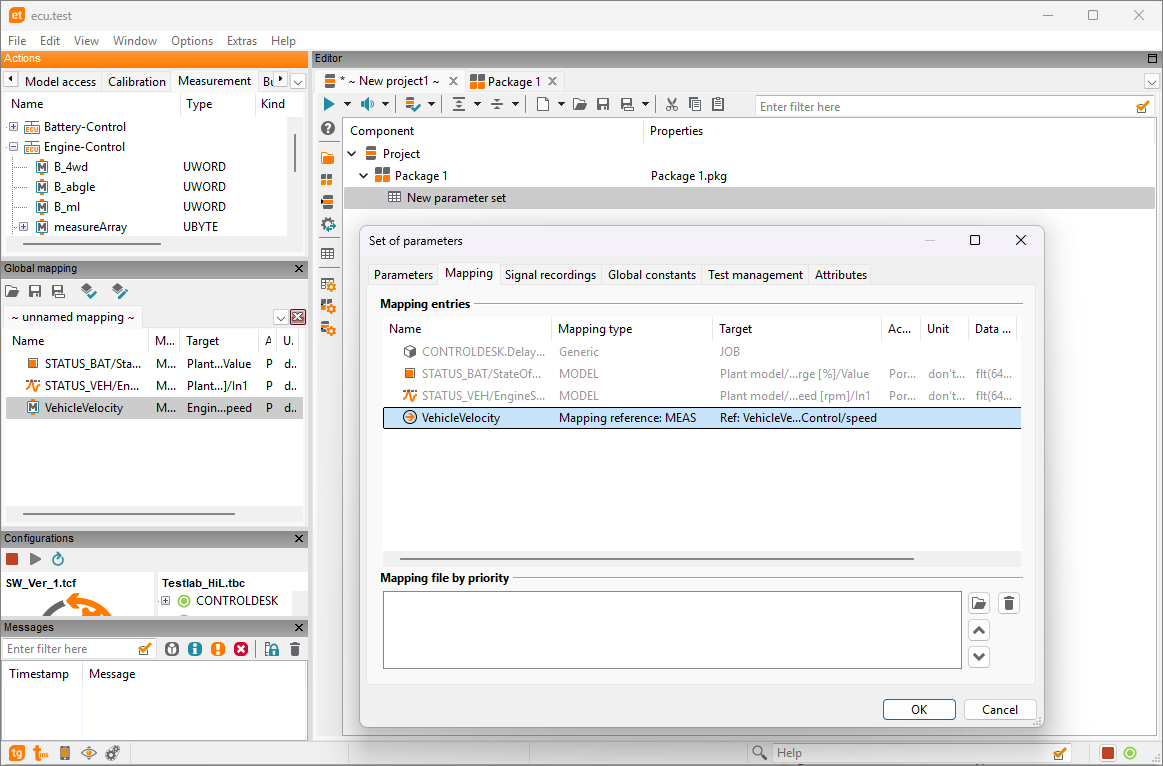
From now on, mappings in the parameter set
A similar approach has been available for some time in the package when calling a sub-package.
With this extension, it is possible to dynamically adapt a parameter set created in this way to changes in the environment by only adjusting the mapping.
- can be overwritten by a specific test value from the action window.
- can also be parameterized with a reference to a mapping from the global mapping.
A similar approach has been available for some time in the package when calling a sub-package.
With this extension, it is possible to dynamically adapt a parameter set created in this way to changes in the environment by only adjusting the mapping.
TTL: Reading of classic buses via TAPs
In the last release, support for reading Ethernet communication from the main logger and the extension boxes (TAPs) was added. With ecu.test 2024.4, it is now also possible to read classic buses such as CAN from TAPs.
Double-click to go directly to the video signal in the toolbox
In the ADAS/AD domain, traces often arise that contain multiple video signals. Until now, there was no connection between the video displayed in the “Video” toolbox and the visible/selected video signals in the graph view.
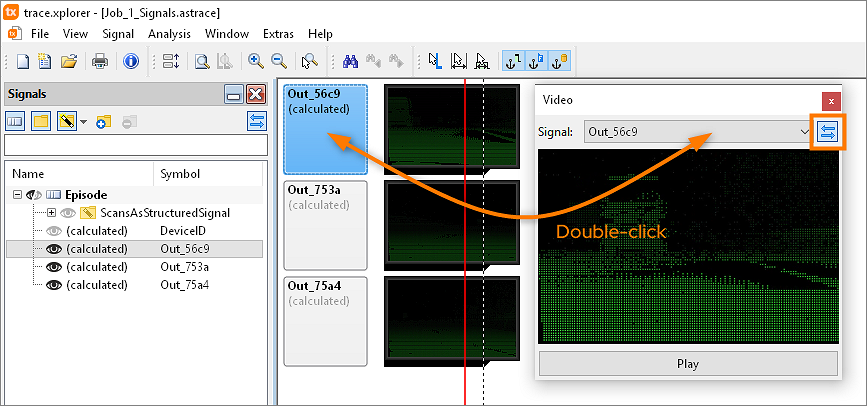
For video signals, double-clicking on the signal header now causes the corresponding video to be displayed in the toolbox. Furthermore, the toolbox contains a new button next to the signal list for automatic synchronization. If this function is activated, the displayed video in the toolbox and the corresponding signal entry in the graph/table view are synchronized. Changing the selection in one of the elements causes the other to be updated automatically.
For video signals, double-clicking on the signal header now causes the corresponding video to be displayed in the toolbox. Furthermore, the toolbox contains a new button next to the signal list for automatic synchronization. If this function is activated, the displayed video in the toolbox and the corresponding signal entry in the graph/table view are synchronized. Changing the selection in one of the elements causes the other to be updated automatically.


